A complete breakdown of the Python backtesting framework I built with Claude Code — and how you can backtest any strategy from a single prompt. Covers the cash-flow engine architecture, the CLAUDE.md context file, overfitting prevention, and a live demo: MA Crossing 20/50 on SPY (2000–2026), +17.0% total return, Sharpe -0.08, 138 trades — including the full AI audit of why the result is bad and what to fix.
Antoine
CEO - CodeMarketLabs
2026-05-16
I did not write this framework. Not really. I described what I wanted to Claude Code — a clean backtesting engine with position management, mark-to-market, and stop-loss-based risk sizing — and it built it. This article covers the full architecture, how the CLAUDE.md file turns the AI into a junior developer on your project, and a live demo: a complete MA Crossing 20/50 strategy on SPY, generated from a single prompt, run over 26 years of data, and audited in minutes.
What this article covers
What a backtest is and why the cash-flow approach is superior to vectorized simulation.
How to structure your data to avoid biases: dividends, splits, and source quality.
How to avoid overfitting with walk-forward validation and Monte Carlo front-testing.
The framework architecture: DATA SOURCES → CORE ENGINE → STRATEGIES → OUTPUT.
How the CLAUDE.md file makes Claude Code generate a full strategy from one prompt.
Full audit of the MA Crossing 20/50 on SPY (2000–2026): +17.0% total return, Sharpe -0.08, 138 trades — and what this result actually tells you.
1. What Is a Backtest — and Why the Cash-Flow Approach Matters
A backtest is simple: you take a trading rule and apply it mechanically to historical data. At every bar from the start of your dataset to today, you apply your signal, open or close positions, and track what your portfolio would have been worth. The result is an equity curve — the value of your portfolio over time. That curve tells you everything: whether you have a real statistical edge, or whether you have been trading a myth.
There are two main implementation approaches. Vectorized backtesting computes signals across the entire dataset in one matrix operation — fast, but it hides frictions and makes it difficult to track the real state of your cash at each point in time. The cash-flow approach, which is what this framework implements, simulates the portfolio bar by bar. At each bar: cash in, cash out, positions marked to market. Your portfolio value at any point is cash plus the live market value of open positions — exactly how a hedge fund computes its NAV. This matters as soon as you care about uninvested cash, multiple simultaneous positions, fees, and the compounding effect of all of these over time.
You can also go beyond historical data with what I call front-testing: generating synthetic price paths via Monte Carlo simulation and measuring strategy performance across hundreds of different market regimes. This answers a different question — not 'did this work in the past?' but 'under what conditions does this strategy work at all?'
2. Data Quality: The Foundation of Any Honest Backtest
Before you can backtest anything, you need clean data. Clean means: available over your target period, at your target frequency, on your target instruments, and free from corporate events that corrupt price series. Dividends and stock splits produce artificial gaps in unadjusted price data that generate false signals in any strategy using raw price levels or moving averages. Always use adjusted close prices.
For most use cases, Yahoo Finance via the yfinance Python library is a solid starting point — adjusted closes on thousands of equities, ETFs, indices, and futures-tracking instruments, free, going back 20+ years. The framework's yahoo_data.py module handles the download, column normalization, and caching automatically. For higher-frequency data, options chains, or more precise futures data, dedicated providers are necessary. A curated list of the APIs I use is available on my tools page.
3. The Overfitting Trap
The most common mistake in backtesting is overfitting: choosing parameters that would have maximized P&L on your historical dataset, then discovering the strategy fails the moment it sees new data. It is easy to build a strategy that looks perfect in hindsight. The hard part is building one with a genuine edge that holds out of sample.
The standard mitigation is to split your dataset into two non-overlapping windows. The in-sample window is used for strategy design and parameter calibration. The out-of-sample window is held back entirely and used only once for final validation. If the strategy works in-sample but fails out-of-sample, you have an overfit. Going further, Monte Carlo front-testing — generating thousands of synthetic price paths with different volatility regimes, drift levels, and jump structures — lets you stress-test the strategy under conditions that may never have appeared in your historical data.
4. The Framework Architecture
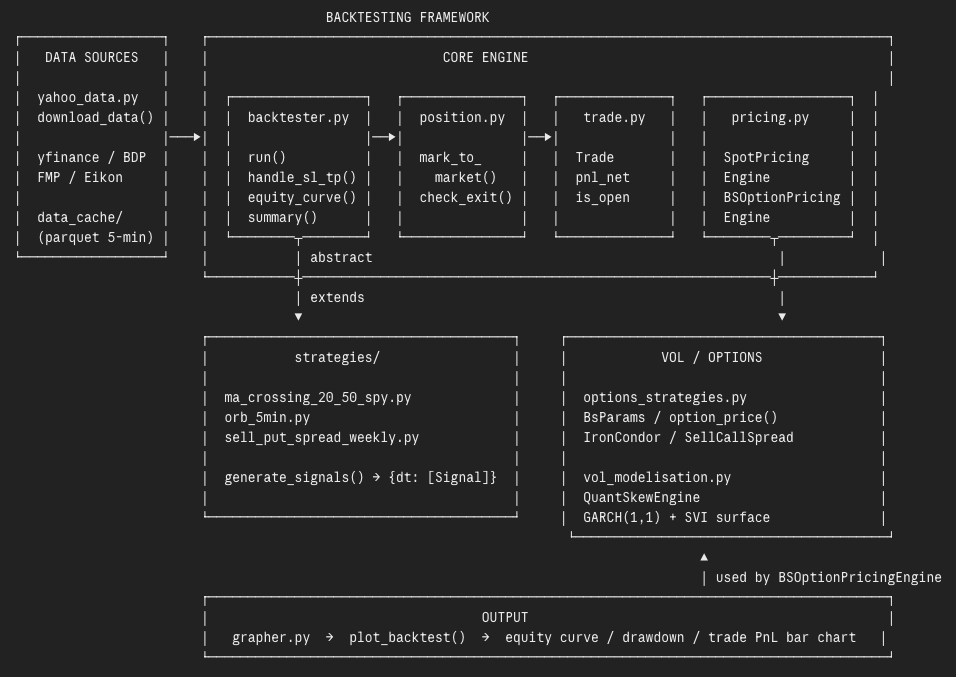
The architecture is organized in four layers, each with a single responsibility. You only ever need to touch one of them.
Backtest Framework Chart
The DATA SOURCES layer handles everything upstream of the engine: downloading price data via yahoo_data.py, normalizing column names, and caching intraday data in parquet format for fast reloads. Supported sources include yfinance, Bloomberg BDP, FMP, and Eikon.
The CORE ENGINE is the heart of the system. backtester.py is the event-driven loop — it iterates bar by bar, checks for stop loss and take profit hits, opens new positions based on incoming signals, and marks the portfolio to market at each step. position.py handles the live mark-to-market of open positions. trade.py represents a booked transaction, with all its attributes: entry/exit price, P&L gross and net, fees. pricing.py provides two engines: SpotPricingEngine for equities and ETFs, and BSOptionPricingEngine for options priced via Black-Scholes with a live volatility surface.
The STRATEGIES layer is the only one you write. Each strategy is a Python class that inherits from the Backtester ABC and implements a single method: generate_signals(). This method receives a DataFrame of market data and returns a dictionary mapping each date to a list of signals. That is it. The engine handles everything else: sizing, execution, P&L, equity curve.
For options strategies, the VOL/OPTIONS layer provides a full volatility modeling stack: options_strategies.py with Black-Scholes pricing, IronCondor and SellCallSpread classes, and vol_modelisation.py with the QuantSkewEngine — a GARCH(1,1) model combined with an SVI surface to generate a realistic implied volatility surface at each date of the backtest.
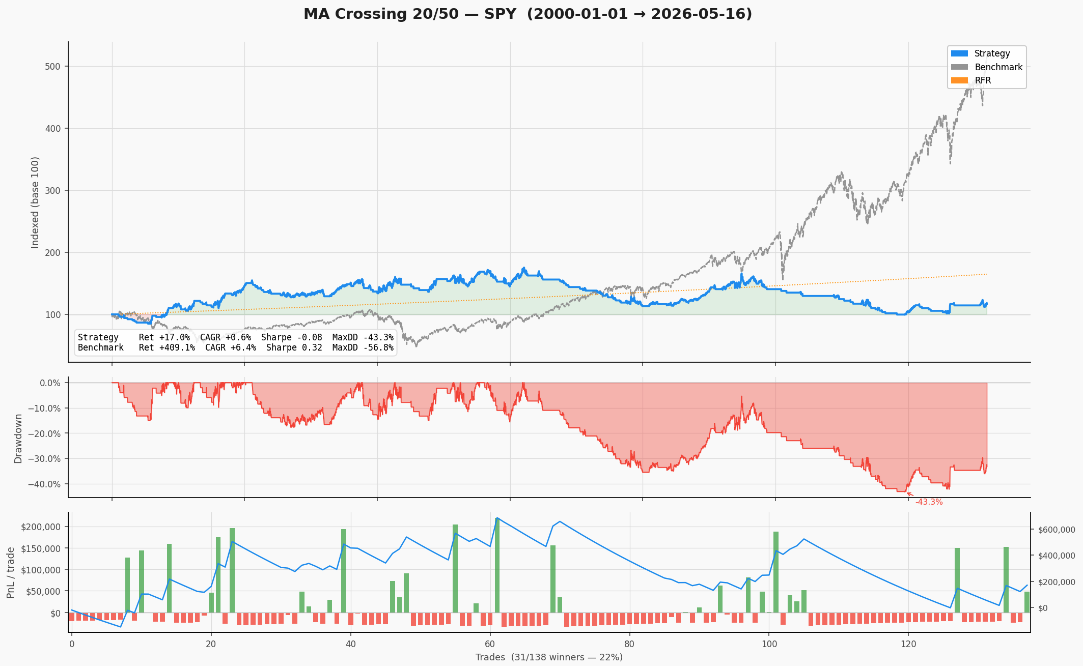
The OUTPUT layer is grapher.py. One function call — plot_backtest() — produces a three-panel report: equity curve indexed to 100 vs benchmark vs risk-free rate, drawdown over time, and individual trade P&L as a bar chart with cumulative P&L overlay.
5. The CLAUDE.md: Making the AI Native to the Project
At the root of the project sits a file called CLAUDE.md. When you open Claude Code in this folder, it reads this file first — it is the AI's full context for everything it does in this codebase.
The CLAUDE.md contains four things. First, the project structure: which files do what, where strategies live, what the classes are called. Second, the generate_signals() contract: exactly what the method must return, date by date, with concrete examples. Third, a list of documented mistakes to avoid — traps encountered during development, written explicitly so the AI does not reproduce them. Fourth, the step-by-step protocol for creating a new strategy from scratch. Claude Code follows this protocol every time, without deviation.
Without the CLAUDE.md, you would need to explain the framework from scratch every session. With it, Claude Code understands the codebase as if it had written it — it knows where to create the strategy file, which interface to implement, how to run the backtest, and how to read the output.
6. Live Demo: MA Crossing 20/50 on SPY — One Prompt, Full Backtest
Here is the exact prompt I sent to Claude Code:
In the backtest folder, generate the following strategy: MA CROSSING 50/20 — long if 20 > 50, short if 20 < 50, SL 2%, TP 15%, on the SPY ETF.
Claude Code reads the CLAUDE.md, identifies the project structure, asks for the missing parameters it needs (period: daily from 2000, sizing: full capital, initial capital: $1,000,000, fees: $10 in / $10 out, benchmark: S&P 500), generates the strategy file in the correct folder, runs the backtest, and outputs the full report. The complete cycle takes under 3 minutes.
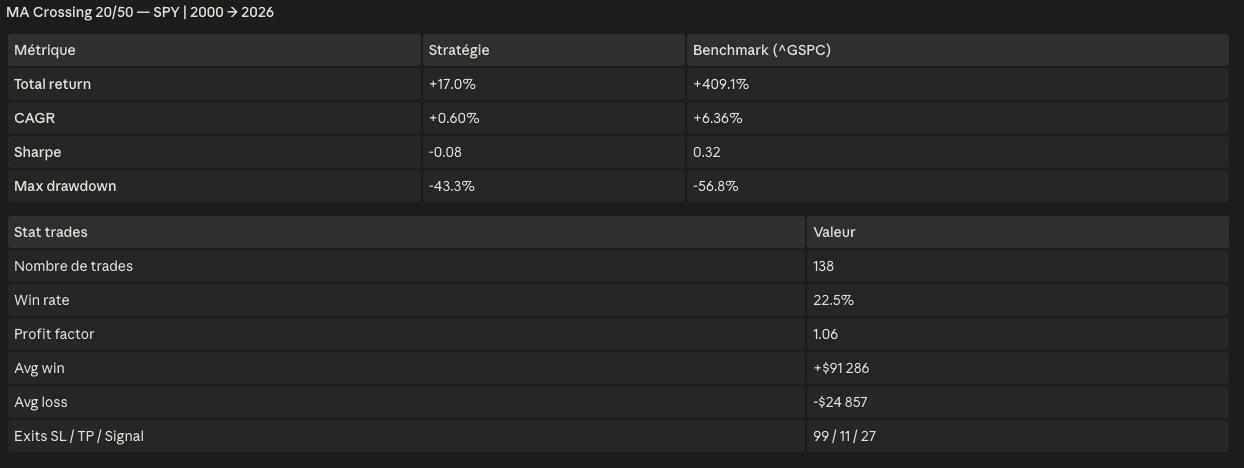
Résultats du backtestRésultats du backtest
The result is instructive precisely because it is bad. The strategy generates +17.0% total return over 26 years against +409.1% for the S&P 500. CAGR of +0.60% vs +6.36%. Sharpe of -0.08. What does Claude Code say about this? It flags it immediately: the stop loss at 2% is too tight for a daily timeframe — 99 out of 138 trades exit on stop loss, generating noise rather than capturing the trend. The take profit at 15% is hit only 11 times. The signal itself — the MA crossover — has some logic, but the risk parameters destroy it. This is the audit step: before you even think about going live, you understand exactly why the strategy is failing and what to adjust.
7. Why Not Backtrader or QuantConnect?
Before building this, I evaluated Backtrader, QuantConnect, and Zipline. All serious, well-documented frameworks. I stopped using them for two reasons.
First: complexity. Before plugging a first strategy into Backtrader, you have hours of documentation to read and a framework-imposed mental model to adopt. That is fine if you want a turnkey solution. It is a problem if you want to understand exactly what the engine does at each bar — and a bigger problem if you want an AI to use it fluently.
Second, and more fundamentally: none of these frameworks are designed to be used by an AI. Claude Code needs an explicit context document. The CLAUDE.md does not exist in the Backtrader or QuantConnect ecosystem. I wanted a minimal framework I understood in every detail, and that Claude Code could use as a native tool. So I built it — with Claude Code.
Do I need to know Python to use this framework?
No. You describe your strategy in plain language, Claude Code generates the Python. You need to be able to install Python dependencies and run a terminal — a 10-minute setup. After that, your input is the strategy description, your output is the equity curve.
What instruments can the framework backtest?
Equities, ETFs, and indices via Yahoo Finance for the spot engine. Options strategies — Iron Condors, put spreads, call spreads — via a Black-Scholes engine with a GARCH-fitted SVI volatility surface. Multi-asset and long/short portfolios are supported in the same backtest loop.
The MA Crossing result is bad — is that normal?
Yes, and it is the point. A 2% stop loss on a daily MA crossover system is too tight — the market noise on a daily bar is larger than your stop, so you get stopped out constantly (99 out of 138 trades). The framework's audit step flags this immediately. The next iteration would widen the stop or replace it with an ATR-based stop, rerun, and compare. This iterative process is exactly what the framework is built for.
How do I avoid overfitting when prompting strategies to Claude Code?
The AI generates the code — it does not decide the strategy or optimize parameters. The overfitting risk sits with you: do not let Claude Code grid-search parameters across your full dataset. Define an in-sample calibration window and a held-out out-of-sample validation window. Treat any parameter selection done in-sample as potentially overfit until confirmed out-of-sample.
Where do I get the framework?
The complete framework including the CLAUDE.md is available on the CodeMarketLabs school page. Download the folder, connect it to Claude Code, and you can run your first backtest within 10 minutes.